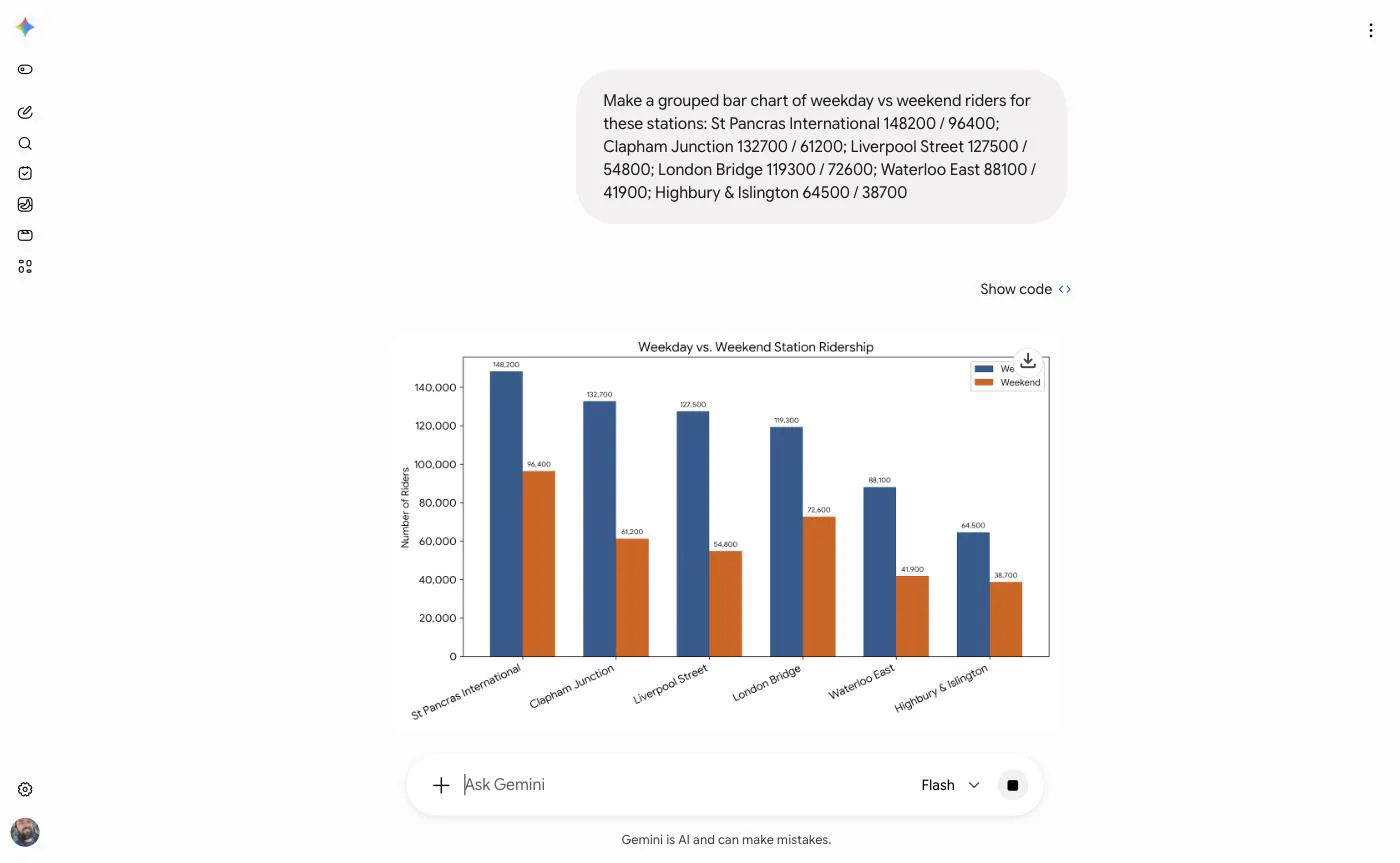
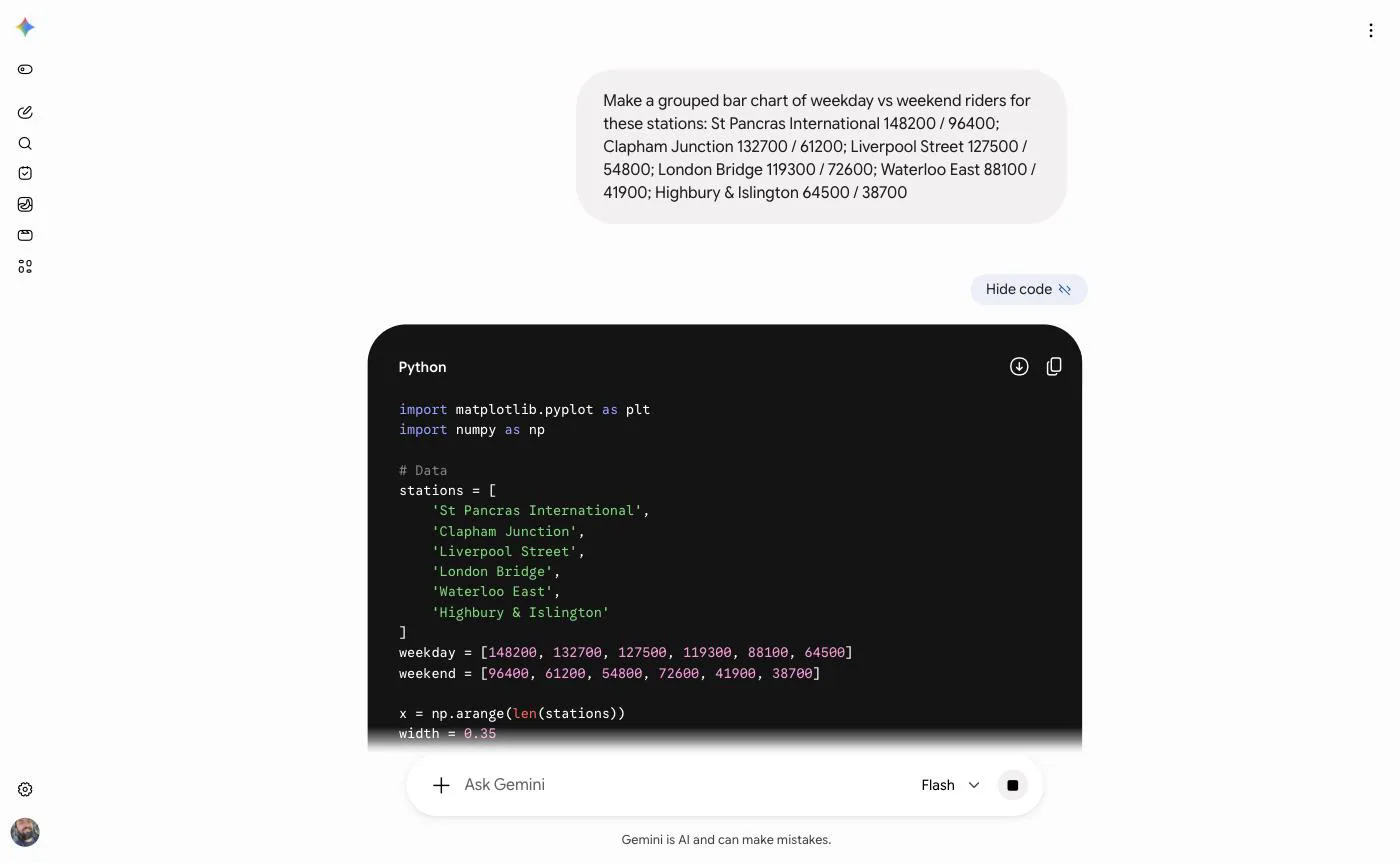
Ask Gemini a question about data and it does not answer from memory. It writes a program, runs the program, and shows you what the program drew. That is implicit code execution — implicit because nobody asked for code. They asked about riders.
The frames above are that path, running in the public product today. A prompt goes in; Python comes out; a chart comes back. Show code is there if you want to see the working.
The problem I was given
A chart that is 90% right is worse than one that is obviously wrong, because you cannot tell which 10% to distrust. And in 2024 the only repair available was to ask again — retype the request, differently, and hope. Every fix was another roll of the same dice that produced the error.
Research put four names to what that felt like: people could not verify where the numbers came from, they burned time re-prompting for small corrections, they froze when handed twenty-plus colour choices, and they could not tell whether the chart type was the right one for their question.
The third and fourth are the interesting pair. Both are the system declining to have an opinion and calling it flexibility.
Designing when you do not know what will ship
Three candidate models were in flight, each capable of something different, and none of them guaranteed. Designing for the best one would have shipped nothing; designing for the worst would have wasted the good one.
So the work was tiered — good, better, best — and specified all three:
| Graphs | Code | |
|---|---|---|
| Good (shipped) | Chart type and label edits only | No editing; export to Replit or Colab |
| Better (limited release) | Editing, plus knowledge of the source file | Edit, run, console output, explanation |
| Best (unshipped) | Full editing and “ask my model anything” | Full editing, execution, co-development |
I am publishing the column that did not ship. Portfolios normally show the “best” column and let you assume it went out the door; the honest thing is the row above, where good is the one marked shipped.
That tiering is the actual skill on display. Not a chart style — a way of committing to a design when the material it runs on is still moving.
What the frames show, and what they do not
The design system I wrote governed chart components: colour families, information density, and a label rule that rotates axis text once the longest label outgrows its bar, rather than truncating it.
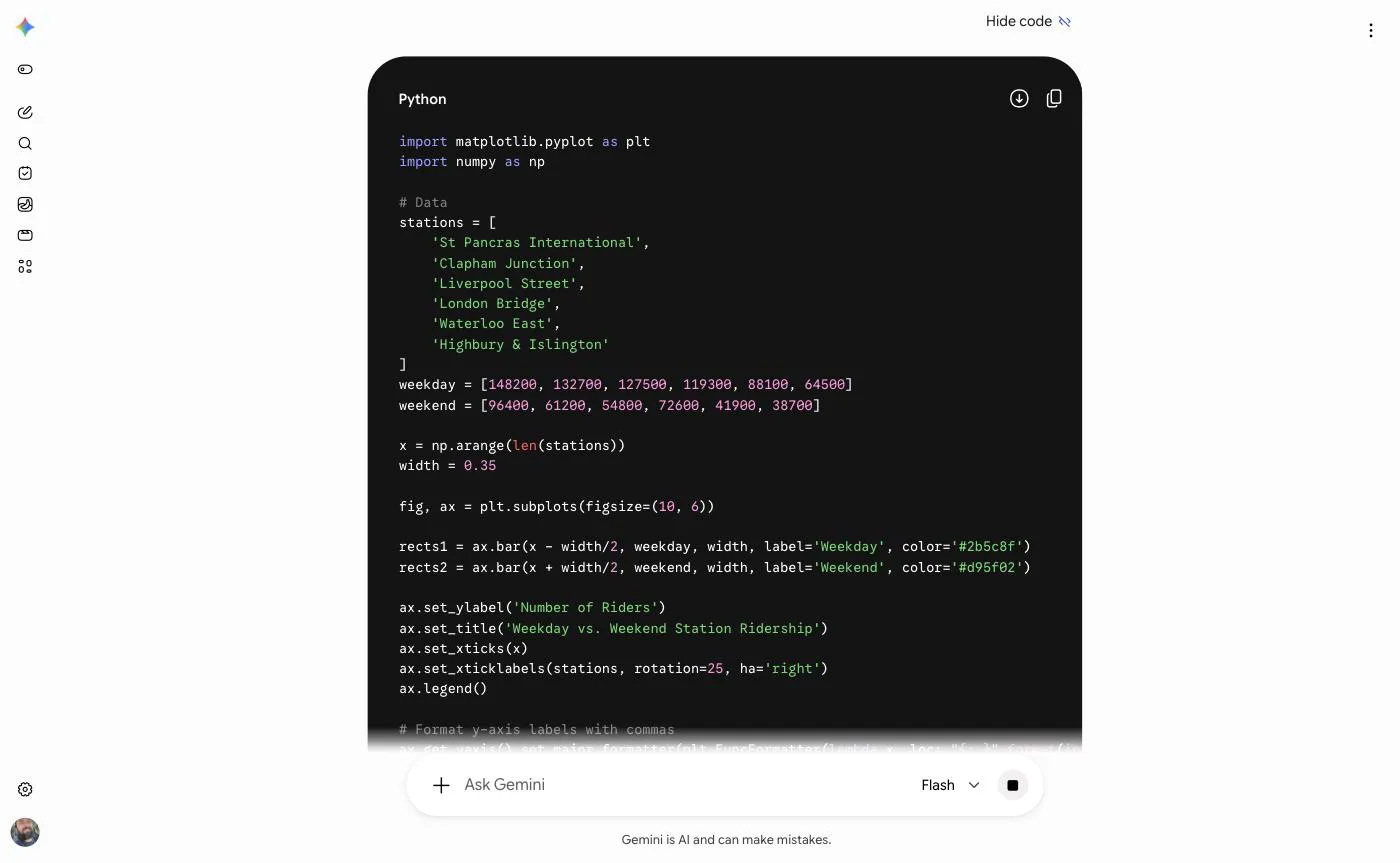
Look at the third frame. The model sets rotation=25 and hardcodes
#2b5c8f and #d95f02. That is model-written matplotlib solving the same
long-label problem by itself, with its own angle and its own palette — not the
component, and not the system. The seam between those two paths is exactly the
“model boundaries” this work was about, and it is still visible in the product
two years later.
I did not design these particular pixels. This is the shipped surface as it stands today, captured to show the path is real and public; the internal screens from my time on it are not mine to publish.
What is not here
No internal mocks, no unreleased UI, no adoption or cost figures. The fuller account, written and cleared by me at the time, is at will-jenn.com/work/gemini-ice.
The outcomes I will stand behind are the ones I published there: people could generate a usable visualization on the first try more often, spent less time validating where data came from, and faced fewer competing options. One research participant put it better than any metric — “it’s as if I can talk to my graphing calculator.”
Why it is here
FormFactors and AIPointerRemix ask a model to say what it cannot see. This asked something harder of a shipping product: when the model is confidently wrong, give the person a repair that is not another prompt. Direct manipulation is not a nicety on top of a language interface. It is the escape hatch that makes trusting the language interface reasonable.